Nonprofit Fundraising Plan: All 7 Sections, No Download
connectNPO · Updated September 2026
Key takeaways
- A nonprofit fundraising plan is a set of decisions with numbers attached, not a list of activities. If it has no amounts, it is a wish list.
- Giving USA reports individuals gave 63.8% of all US charitable dollars in 2025 — $394.2 billion of $617.20 billion. Most small plans spend their effort elsewhere.
- Bequests grew 19.7%, the fastest of any source — and in our experience the line small organizations are least likely to have planned for.
- The full plan structure is published below, with no download and no email required. Copy it.
- Size it honestly: three revenue lines you actually work beat eight you list and abandon by March.
Most people arrive at this question in October, with a board meeting coming and a blank document open. The year is nearly gone, next year needs a number, and every guide you find offers a template in exchange for your email address.
So here is the whole nonprofit fundraising plan structure, in the open, with the reasoning attached. Take what fits and leave the rest.
One thing before the structure, because it shapes everything after it. A plan is a document, and documents do not raise money. The records, the sending and the follow-up underneath them do. Plans that quietly fail are usually sound on paper and have nothing to run on, which is the layer this article keeps returning to.
What the plan has to decide
A nonprofit fundraising plan is not a description of what you do. It is the set of choices you are willing to be held to. A document that says “grow individual giving, apply for more grants, hold a spring event” has decided nothing, because every one of those was already true.
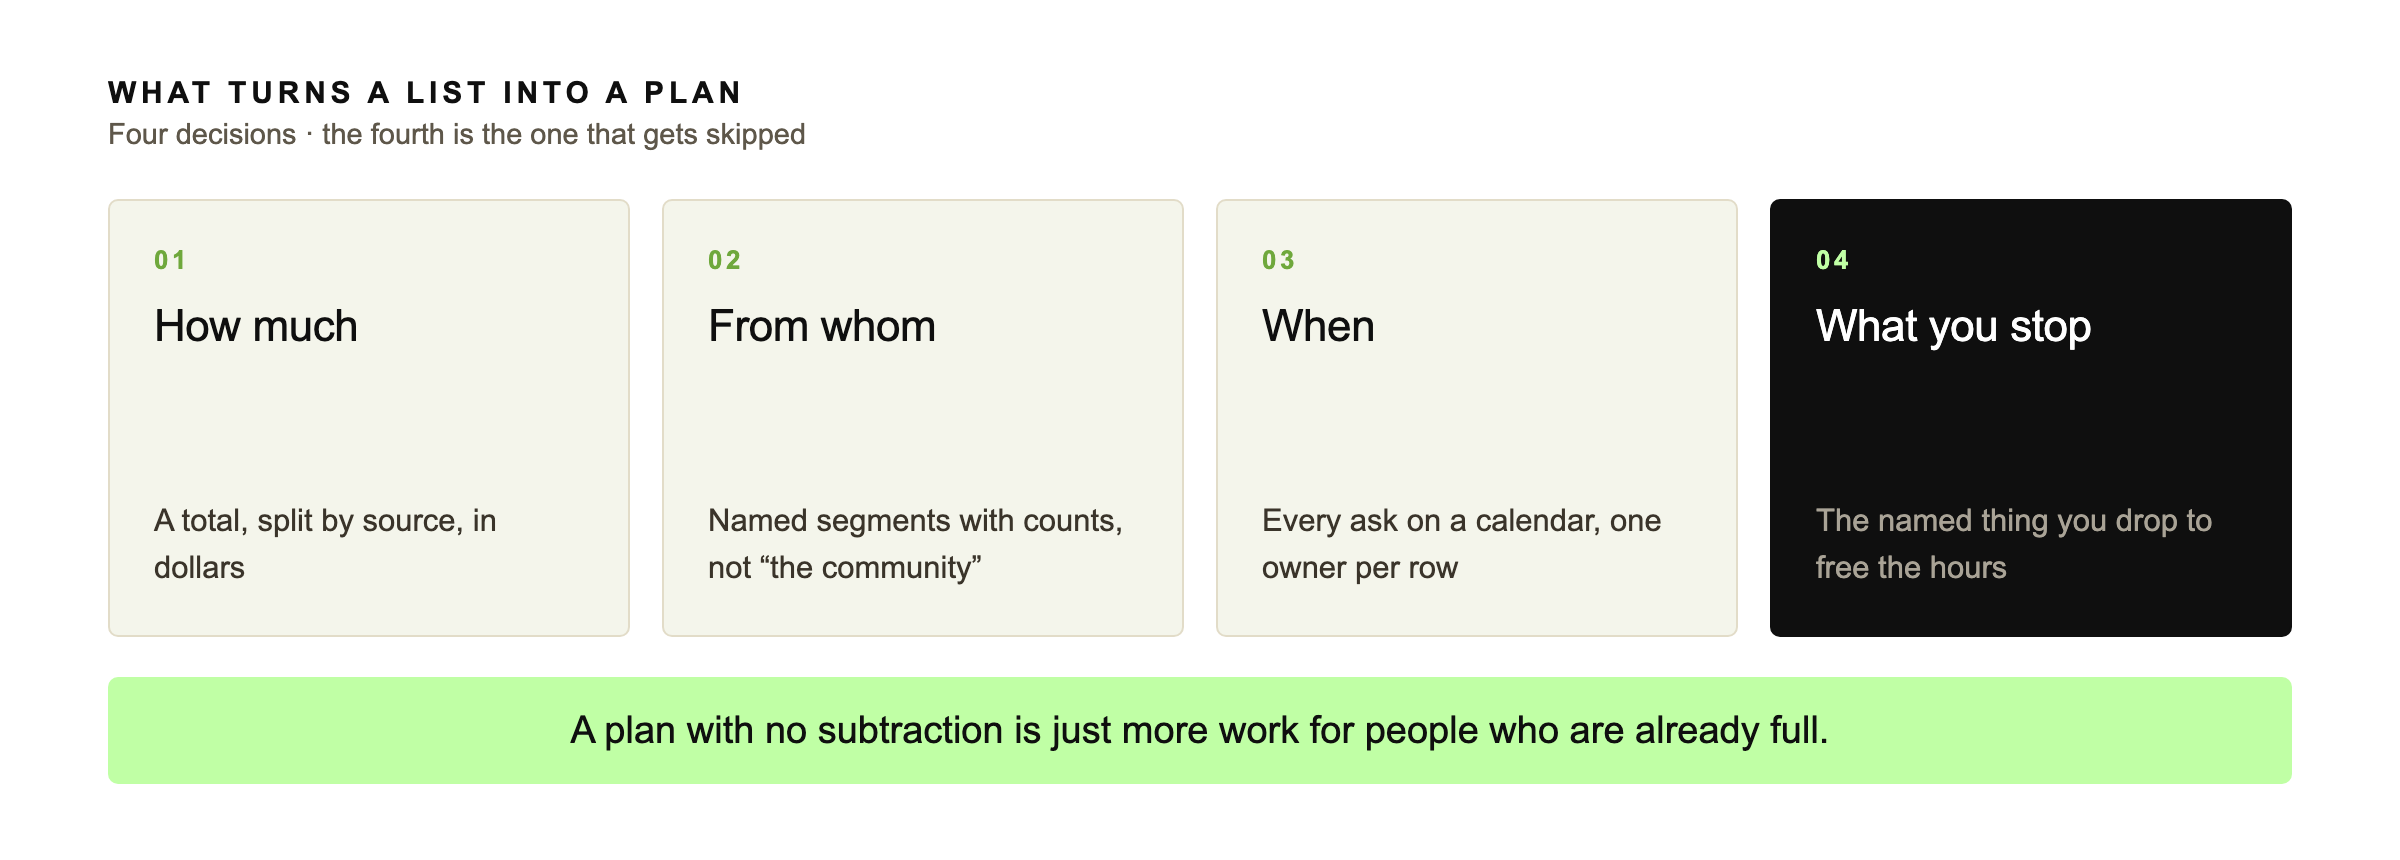
The difference is a grocery list against a week of recipes. Both mention food. Only one tells you how much to buy and which night you are cooking it. Four decisions make it a plan:
- How much, in total, and split by source.
- From whom — named segments, not “the community.”
- When each ask happens, on a calendar someone owns.
- What you will stop doing to make room for it.
The fourth is the one that gets skipped, and it is the one that makes the other three real. A plan with no subtraction is a list of additional work for people who are already full.
Where the money actually comes from
Before you split a goal, it helps to know how the sector’s money divides. Giving USA 2026, researched by the Indiana University Lilly Family School of Philanthropy, put total US charitable giving at $617.20 billion in 2025, up 5.7% and 3.0% after inflation. One scope note that matters more than it sounds: Giving USA counts private philanthropy to 501(c)(3) organizations only. Government grants and contracts, and earned revenue such as fees for service, are not in these totals at all.
US private giving 2025 · $617.20 billion
Foundations — $117.15B, up 5.7%
Bequests — $62.19B, up 19.7%
Corporations — $43.67B, up 3.1% but flat after inflation
Shares are calculated from Giving USA’s published dollar figures; the source table lists amounts and growth rates rather than percentages.
Two things are worth carrying into your own numbers. Individuals are almost two-thirds of all private giving, and bequests grew nearly 20%, faster than any other source. In our experience the bequest line is also the one small organizations are least likely to have written down at all, though no benchmark measures that.
These are national totals across every cause and organization size, so they are a map of the country, not a forecast for you. A food bank and a chamber choir do not share a revenue mix. Use them to check whether your split is wildly out of step, not to set it.
The nonprofit fundraising plan itself
Seven sections — this is the structure we use, not a sector standard. No download, no form. Copy the headings into a document and fill them in.
Section 1 is the one people skip because it is uncomfortable, and it is the only section that makes section 2 credible. A goal set without last year’s actuals is a number someone invented in a meeting.
A realistic year, month by month
Fundraising years have a shape, and fighting it costs more than working with it. This is a calendar-year version; shift it if your fiscal year starts elsewhere.
Q1January – February
Thank everyone who gave in December, properly and individually where you can. Close last year’s numbers. Write the plan while the actuals are fresh.
Q2March – May
The quiet stretch, and the best time for the work that has no deadline: lapsed-donor outreach, a monthly giving push, foundation research, fixing your donation page.
Q3June – August
Mid-year check against the plan. Publish something that shows the work — this is when your annual report earns its keep. Prepare year-end while nobody is rushed.
Q4September – December
Year-end, and the numbers are lopsided. M+R put 37% of all 2025 online revenue in December alone, with the final week accounting for 10% of the year and the last day 4%. Everything sent now should have been written in August, because December is for sending and thanking, not drafting.
Those December figures come from M+R Benchmarks 2026 and describe online revenue in M+R’s study specifically, not every dollar you raise. M+R publishes no equivalent timing data for mail, so treat the shape rather than the exact share as the takeaway: a garden runs on the same logic, and the work that decides the harvest happens in the quiet months, not the week you want to pick something.
Sizing it to the team you have
A nonprofit fundraising plan fails on capacity far more often than on strategy. If one person carries fundraising alongside two other jobs, three revenue lines worked properly will beat eight listed and abandoned.
For a first plan, or a very small team, take these three and stop:
- Renew what you have. The people who gave last year are the cheapest money in the plan, which is the whole argument in donor retention.
- One recurring-gift push. M+R put monthly giving at 27% of online revenue in its 2025 study, and predictable revenue is worth more than its face value because it removes guessing from next year’s plan.
- One year-end appeal, done well, with the email sequence written in advance rather than improvised in December.
Grants can be the right fourth line, particularly where a funder’s stated priorities already match work you are doing. They are slow, they arrive on the funder’s schedule rather than yours, and they are a poor answer to a cash-flow problem. Plan them as a lift for programs you have, not as the thing that saves the year. The one exception is Google Ad Grants, which is not revenue at all but ad budget, and belongs under acquisition rather than under grants.
How you will know it is working
Two numbers, reviewed monthly, beat a dashboard nobody opens. This is the part of a nonprofit fundraising plan that decides whether the rest of it survives March. Pick from these, write them into section 7, and do not change them mid-year:
- Dollars raised against plan, by source. Not total against total — the split is where problems show first.
- Donors retained. How many of last year’s givers have given again this year.
- New donors added, and where they came from.
- Recurring revenue, as a monthly figure you can watch climb.
Nobody checks the fuel gauge once a year and calls it fuel management. Reviewed in January, these numbers are a postmortem. Reviewed monthly, they are still something you can act on, and that difference is most of what separates a plan that works from a document written once a year.
If the plan keeps not happening
It is usually the page people land on, not the plan.
A plan only works if the page people land on can carry it, and if a funder who checks you finds what they expect. That is what we build. See how we work, or look at what support costs.
Frequently asked questions
What should a nonprofit fundraising plan include?
Seven sections. Last year in actuals, one total goal taken from the budget, and that goal split by source in dollars. Then the segments you will ask with their counts, and a calendar with one owner per row. Finally the costs plus the thing you are dropping to make room, and the two numbers you will review monthly. The full structure is published in this article with no download required.
How long should a fundraising plan be?
Short enough that the person responsible reads it more than once. Two to four pages covers the seven sections for most organizations under a million dollars. Length is not the measure; a plan is finished when every line has a number, a date and a name against it.
How much should we expect from individual donors?
Giving USA reports individuals gave 394.2 billion of 617.20 billion dollars in 2025, which works out to 63.8%. Two limits matter: it is a national figure across every cause and organization size, and it counts private philanthropy only, so government grants and earned revenue are excluded. Treat it as a check on whether your split looks unusual rather than as a target. Your own last three years are the better guide.
When should we write the plan for next year?
January or February, once December has closed and the actuals are real. Writing it in the fall means guessing at the quarter that produces most of the money. If you are reading this in October, write a short version now and a full one after year-end.
Should grants be the main line in our plan?
Rarely, for an organization of this size. Foundations accounted for 19.0% of US giving in 2025 against 63.8% from individuals. Grants arrive on the funder timetable, not yours, which makes them a poor answer to a cash-flow gap. They work best as a lift for programs you already run.
Figures are from Giving USA 2026, researched and written by the Indiana University Lilly Family School of Philanthropy for the Giving USA Foundation, covering 2025, and from M+R Benchmarks 2026, whose December figures describe online revenue only. Both were current when this article was published. connectNPO does not provide legal, tax, accounting, or Form 990 advice.