Nonprofit KPIs: 6 Metrics and What Normal Looks Like
connectNPO · Updated September 2026
Key takeaways
- Most nonprofit KPI articles give you a list. The harder question is what number counts as normal, so this one gives the published figures alongside each metric.
- Reference points: donor retention 18.0% (Fundraising Effectiveness Project, Q1 2026); annual email churn 18.8%, desktop donation page conversion 10.9% and revenue per website visitor $1.33 (M+R Benchmarks 2026, on 2025 online revenue).
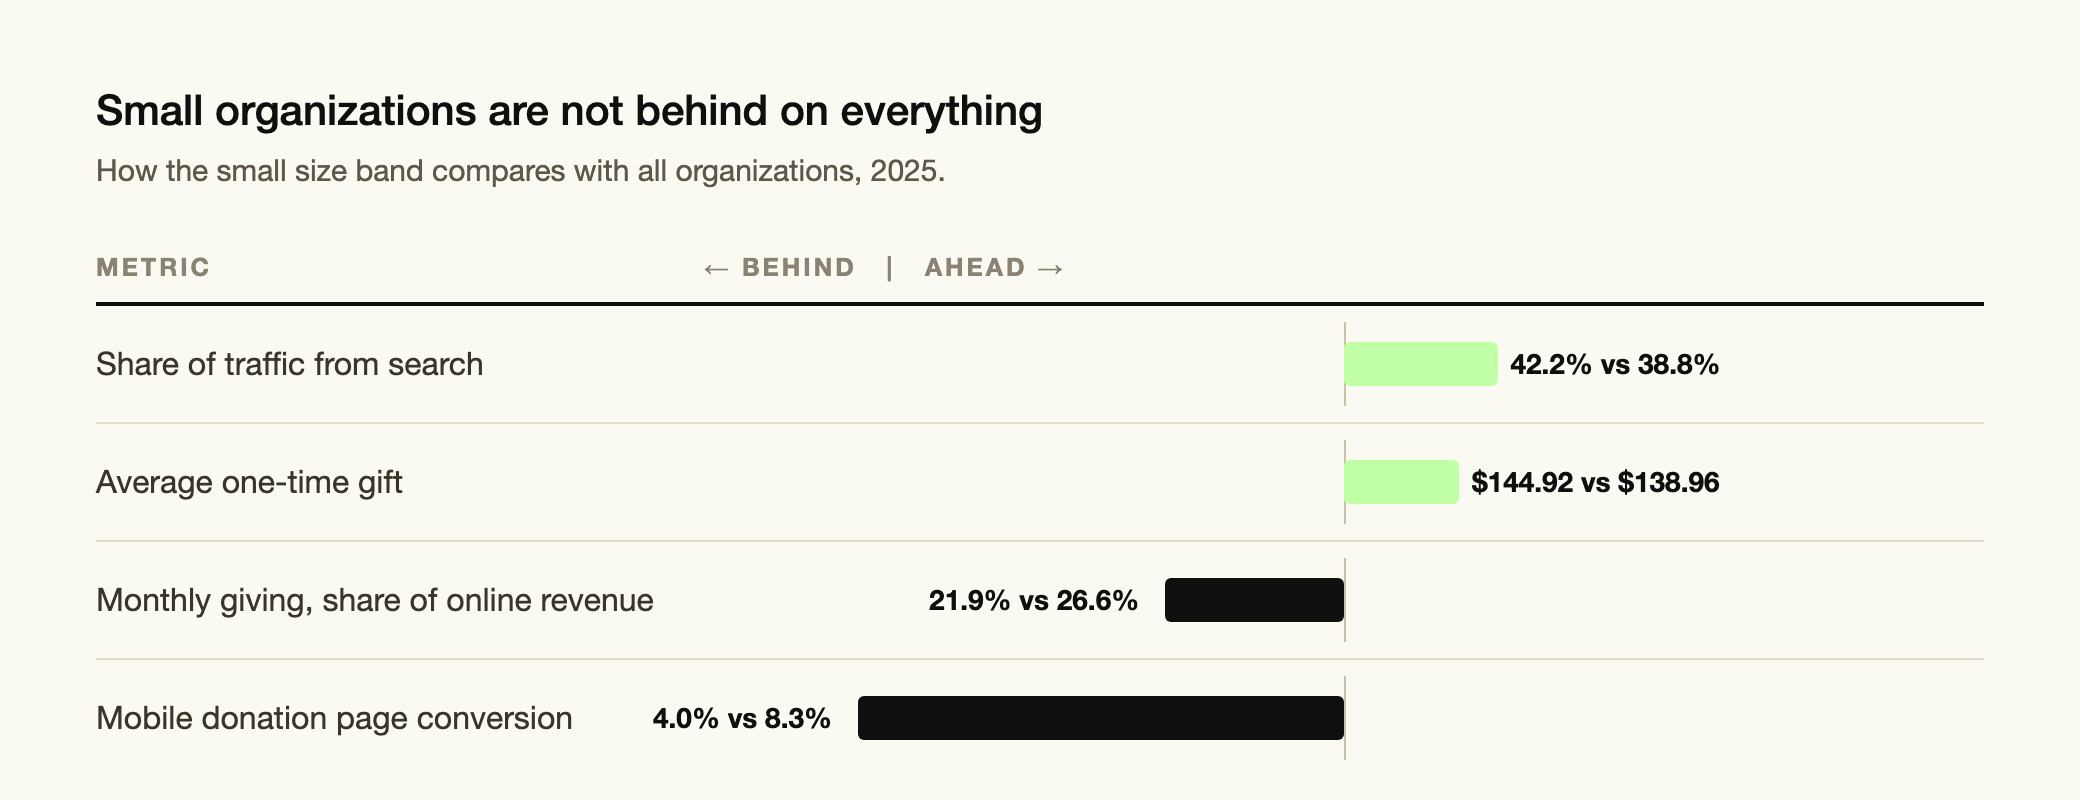
- M+R size bands are not uniformly behind. Its Small band draws 42.2% of traffic from search, the highest of the four bands, and averages a $144.92 one-time gift against $138.96 across all organizations.
- The band trails in two places: mobile donation page conversion 4.0% against 8.3% overall, and monthly giving at 21.9% of online revenue against 37.5% at the largest.
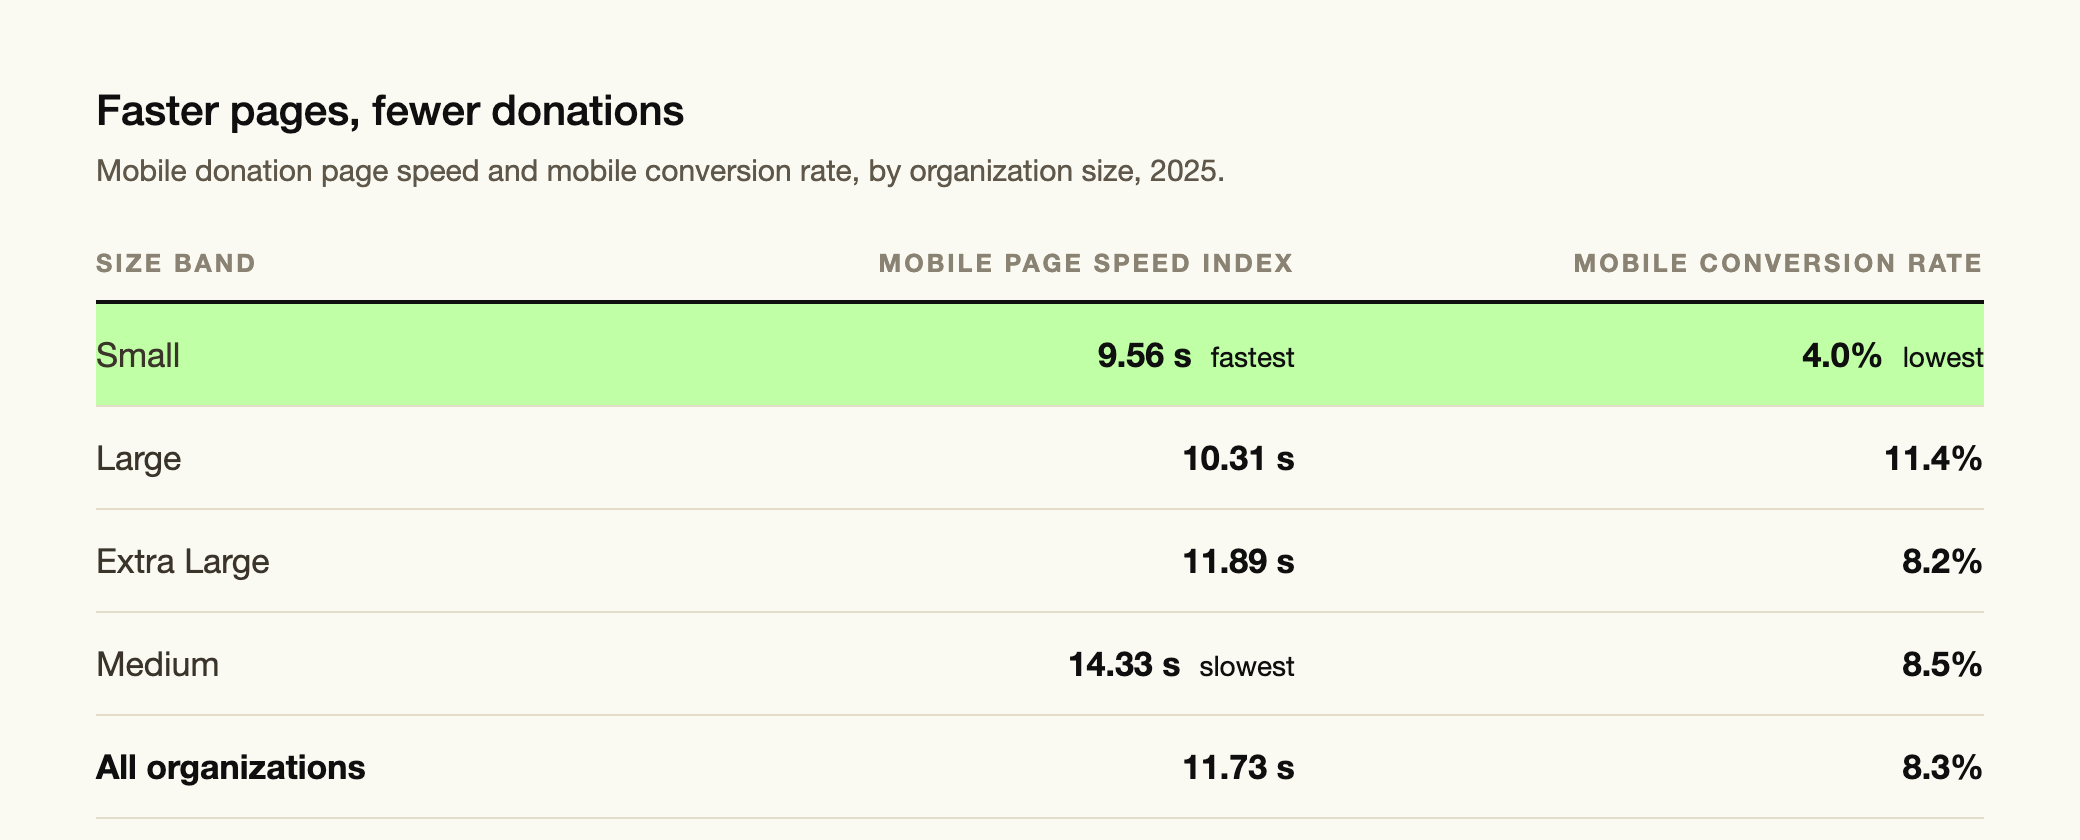
- Mobile speed and mobile conversion do not line up across the bands. The Small band has the fastest mobile donation pages of the four and the lowest mobile conversion rate.
Six nonprofit KPIs, with what normal looks like
Search for nonprofit KPIs and you will find lists. Eight of them, twelve, fourteen, twenty-six, thirty, thirty-five and counting. They are not wrong. They are just not the thing you were trying to find out, which is whether your own number is any good.
A retention rate of 31% means nothing on its own. It means something the moment you know the sector figure. So here are six numbers a small organization can hold in its head, each with a published reference point next to it.
| Metric | Reference point | Source and notes |
|---|---|---|
| Donor retention | 18.0% | FEP, Q1 2026 |
| Online one-time retention, new donors | 24.0% | M+R 2026 — 66.2% for donors who had already given more than once |
| Annual email list churn | 18.8% | M+R 2026 |
| Donation page conversion | 10.9% desktop 8.3% mobile |
M+R 2026 |
| Revenue per website visitor | $1.33 | M+R 2026 — across all traffic, 1.55% of visitors give |
| Monthly giving as a share of online revenue | 26.6% | M+R 2026 |
Sources: M+R Benchmarks 2026 (2025 data, online revenue only) and the Fundraising Effectiveness Project Q1 2026 report.
Read the scope before the number. The M+R figures cover online revenue only, drawn from a panel whose digital teams run to a median of six people. Its Small band means annual online revenue under $1 million, with five digital staff on average — larger than most organizations reading this. The FEP retention figure is drawn from a panel of organizations under $25 million a year and includes offline gifts such as checks and cash. Neither set is a target handed to you. They are the reference points that turn your own number from a fact into a judgment.
Where small organizations come out ahead
Benchmark articles tend to assume small organizations trail on everything, so the useful part of the M+R data is the size breakdown, which says otherwise. Two of these numbers run in your favor.
Share of traffic from search
42.2% small band
38.8% all organizations
Average one-time gift
$144.92 small band
$138.96 all organizations
Source: M+R Benchmarks 2026, by organizational size band.
The Small band draws the highest share of web traffic from search of the four bands, at 42.2% against 39.2% for Extra Large and 31.5% for Large. The largest organizations draw the lowest average one-time gift of the four, $115.83 against $147.72 at Medium. Both matter, because they change what a reasonable priority list looks like. If search is where four visitors in ten already come from, search is not an experiment for later. Our post on nonprofit SEO works through what that traffic is made of. The paid half of the same results page has its own programme, covered in our post on Google Ad Grants.
Where they come out behind
The same breakdown is unsparing in the other direction, and the two gaps are large enough to be worth naming precisely.
Mobile donation page conversion is 4.0% at small organizations against 8.3% across the study. It is the only metric here where the small-organization figure is less than half the overall one.
Monthly giving accounts for 21.9% of online revenue at small organizations, against 26.6% overall and 37.5% at the largest.
Source: M+R Benchmarks 2026.
The monthly giving gap is the one with the longer tail, because a sustainer keeps giving without being asked again. M+R tracks how many stay: 82.2% of sustainers are still giving at six months, 70.9% at twelve, and 54.0% at twenty-four. That is a measure of donors retained rather than revenue, but it is the closest published read on how long a monthly commitment lasts. Our post on year-end giving covers why the monthly option has to exist before the season starts.
The mobile gap is not a speed problem
The standard advice for a bad mobile conversion rate is to make the page faster. In this data that advice does not fit, and the reason is worth spelling out because it saves a quarter of work aimed at the wrong thing.
The Small band has the fastest mobile donation pages of the four size bands, at a speed index of 9.56 seconds against 11.73 across all organizations. It also has the lowest mobile conversion rate, at 4.0%. Medium is the slowest band at 14.33 seconds and converts mobile visitors at 8.5%, more than twice the Small figure.
Source: M+R Benchmarks 2026 for page speed and M+R Benchmarks 2026 for conversion, both reporting on 2025.
M+R does not say why, and we are not going to invent a reason. What the two columns establish is narrower than it first looks, and worth stating precisely: speed does not explain the ranking between bands, because the fastest band converts worst and the slowest converts twice as well. That does not prove speed is costing nobody anything — every band here is slow in absolute terms. It does mean that being faster than the other bands has not bought the Small band a better mobile conversion rate, so a quarter spent shaving seconds is a quarter spent on the wrong variable.
Which of these you can move this quarter
Six metrics is a reading list, not a work plan. These are ordered by how quickly a small team can affect them, fastest first.
Mobile donation page conversion
Weeks, not quarters. Open your own donation page on your own phone and try to give ten dollars. Whatever stops you is the place to start.
Monthly giving share
One quarter. M+R does not publish a reason for the 21.9% against 26.6% gap, so treat it as a number to close rather than a diagnosis. The first thing to check is simply whether a monthly option exists on the page a donor lands on.
Email churn
Two quarters. Our post on nonprofit email marketing covers what moves it.
Donor retention
A year, because it is measured over a year. It is the slowest number here to move and the most misleading to check monthly. Our post on donor retention covers how to calculate your own.
If you are choosing one, choose the first. It is the only gap on this list where the Small band figure is less than half the overall one, it is the cheapest to investigate, and it is the only one you can check yourself in the next ten minutes.
What this article deliberately leaves out
Most nonprofit KPI lists mix two different kinds of number together. Alongside donor retention and conversion rates they include operating reserve months, program efficiency ratio, and cost to raise a dollar. Those are financial statement measures, and reading them correctly depends on how your organization classifies expenses.
We have left them out on purpose. connectNPO does not provide accounting advice, and a benchmark for a ratio we cannot help you calculate correctly would be worse than no benchmark. Those belong in a conversation with your accountant, who can see how your books are actually structured. Everything above is a marketing, fundraising or website number, which is the part we can help you move.
connectNPO does not provide legal, tax, accounting, or Form 990 advice.
Not sure which of your numbers is the one to fix?
We can look at your donation page, your traffic and your list against these reference points and tell you where the largest gap sits.
Frequently asked questions
Which nonprofit KPIs should a small organization track?
Six is enough to start: donor retention, new-donor retention, email list churn, donation page conversion split by desktop and mobile, revenue per website visitor, and monthly giving as a share of online revenue. Each of those has a published reference point you can compare yourself against, which is what makes them useful. Financial statement ratios such as operating reserves and program efficiency are a separate category and belong with your accountant.
What is a good donor retention rate?
The Fundraising Effectiveness Project put sector retention at 18.0% in its Q1 2026 report, drifting gently down from a 2024 high of 18.2%. That figure covers all channels across 15.7 thousand organizations. M+R measures a narrower thing, online one-time donor retention, and reports 48.0% overall, 24.0% for new donors and 66.2% for donors who had already given more than once. The two are not interchangeable, so compare yourself against whichever one matches the way you counted your own.
What is a normal donation page conversion rate?
M+R reports 10.9% on desktop and 8.3% on mobile for 2025. The size breakdown matters more than the average here. Small organizations converted mobile visitors at 4.0%, less than half the overall figure, while their desktop rate of 9.4% sits close to normal. If you only look at a blended number you will miss that split entirely, so measure the two separately.
Do these benchmarks apply to an organization with no digital staff?
Not directly, and it is worth being honest about that. M+R reports a median digital team of six people among its participants, and its Small band means annual online revenue under $1 million with a median of five digital staff. Even the smallest band is an organization with dedicated digital people. Treat the figures as reference points rather than targets. The size breakdowns are the more useful part, because they show which direction a smaller organization tends to differ, and that pattern transfers further than the exact percentage does.
How often should we review these numbers?
As often as each one can move, which is not the same interval for all six. Donation page conversion responds within weeks. Donor retention is measured across a full year, so checking it monthly mostly produces noise. Our guide to building a nonprofit fundraising plan works through which numbers belong in a standing monthly review and which do not. A short list reviewed on a schedule you keep beats a dashboard nobody opens.